




Muscle activation
Muscle activation refers to the extent to which the muscle fibers of a muscle are activated. A low level of activation means that very few muscle fibers were switched on, while a high level of activation means that a large number of muscle fibers were switched on. There are various methods that can provide insights into muscle activation.
.
#1. Electromyography (EMG)
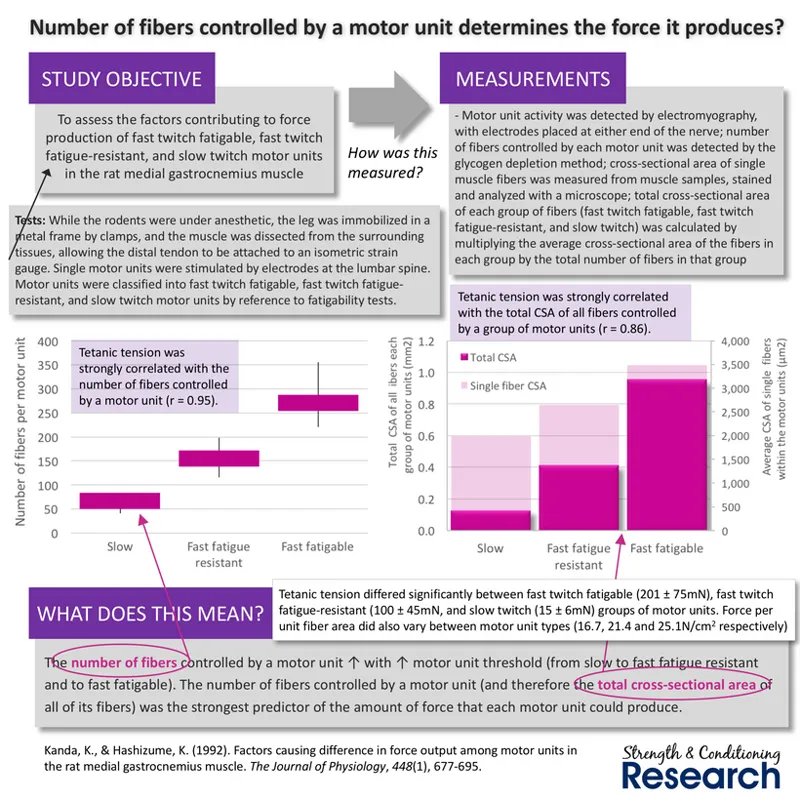
Electromyography (EMG) is a measurement tool for detecting the electrical signals that are transmitted along the length of activated muscle fibers. In this way, it gives a good indication of the number of muscle fibers that are switched on during a muscular contraction. During unfatigued isometric contractions, the EMG signal magnitude is almost perfectly associated with both intramuscular pressure and external isometric force production.
.
Importantly, the amount of force that any single motor unit can generate is very closely related to the number of muscle fibers that it contains. This means that there is necessarily a close relationship between unfatigued, isometric muscle force and motor unit recruitment levels. Thus, when we identify a relationship between a measurement of muscle activation and unfatigued, isometric muscle force, it is highly likely that this measurement is telling us about the number of recruited motor units and the number of activated muscle fibers.
.
#2. T2 signal intensity using magnetic resonance imaging (MRI)
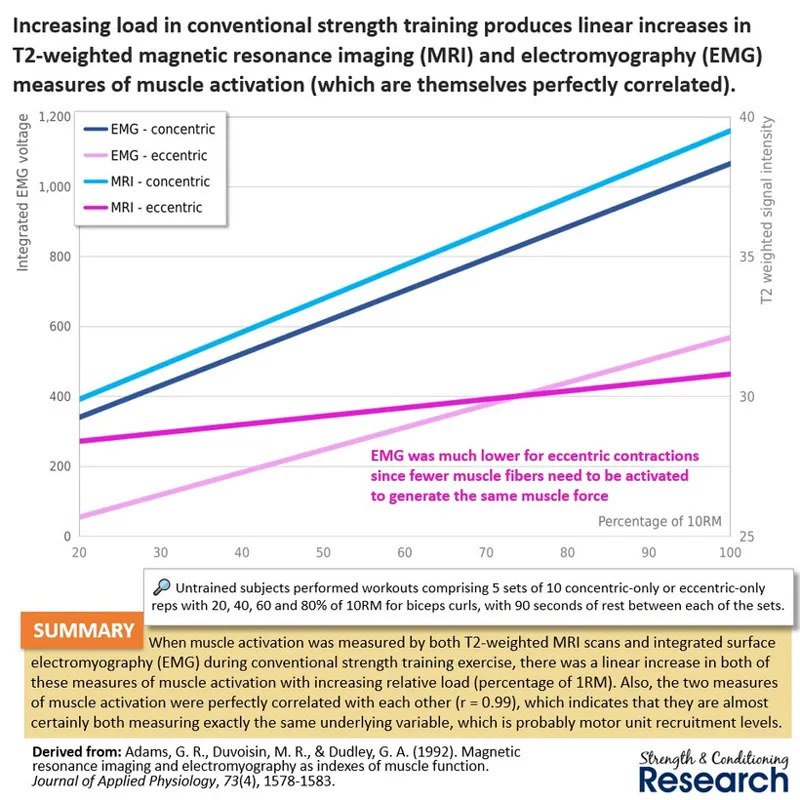
T2 signal intensity measures recorded using MRI scans are not performed during exercise but instead are taken immediately afterwards. They record fluid shifts within the muscle, which are produced during muscular contractions due to acidosis and which remain in place for several minutes afterwards. They therefore reflect the amount of metabolic activity that took place. During strength training, T2 signal intensity increases perfectly in line with external load in an exercise.
.
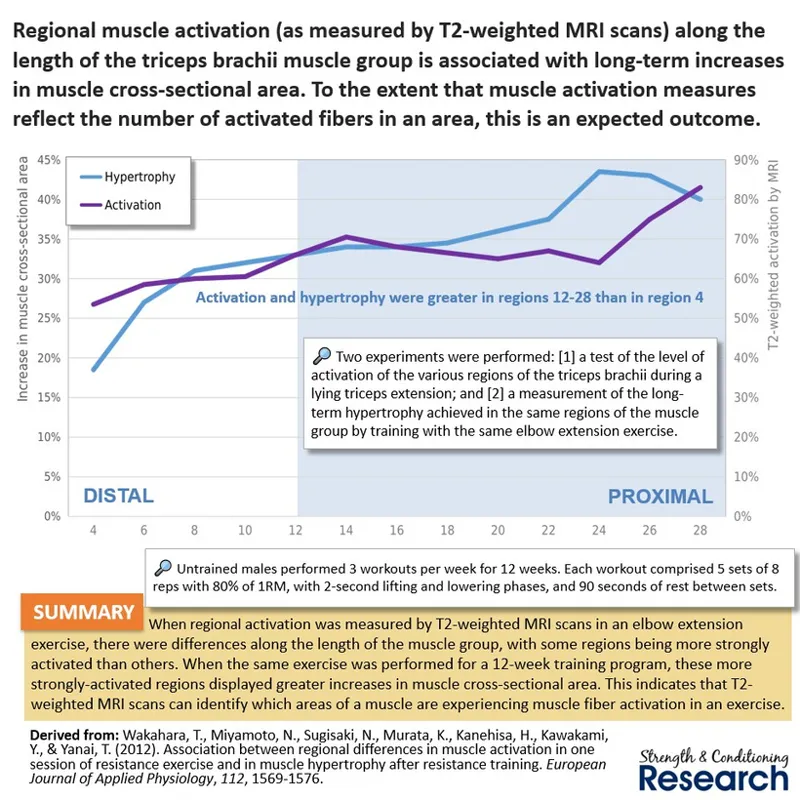
T2 signal intensity measures recorded immediately after exercise have revealed that there can be regional differences in muscle activation along the length of a muscle group during single-joint exercise. Moreover, such differences in regional muscle activation correspond to the differences in regional hypertrophy after exercise. This would be expected if the measure of muscle activation were showing us the number of activated muscle fibers in each of the muscles within the group during exercise.
.
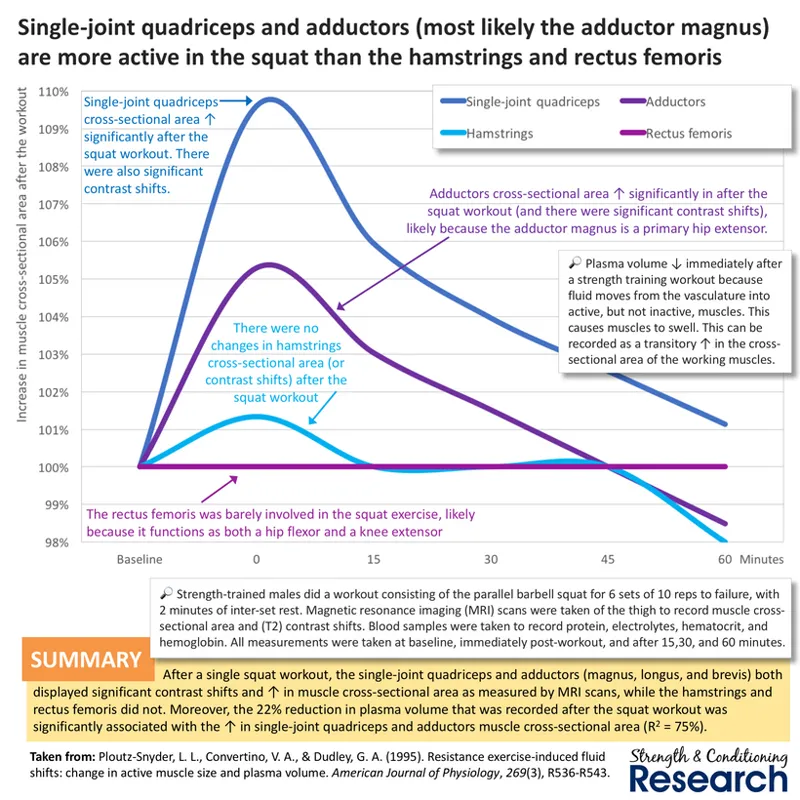
Furthermore, T2 signal intensity measures of muscles immediately after exercise have revealed that there can be differences in muscle activation between muscles during multi-joint exercise. Here, we can see differences between the various hip extensors and knee extensors in a squat exercise. The single-joint quadriceps and adductors are highly activated, while the hamstrings are only slightly activated and the rectus femoris is entirely silent.
.
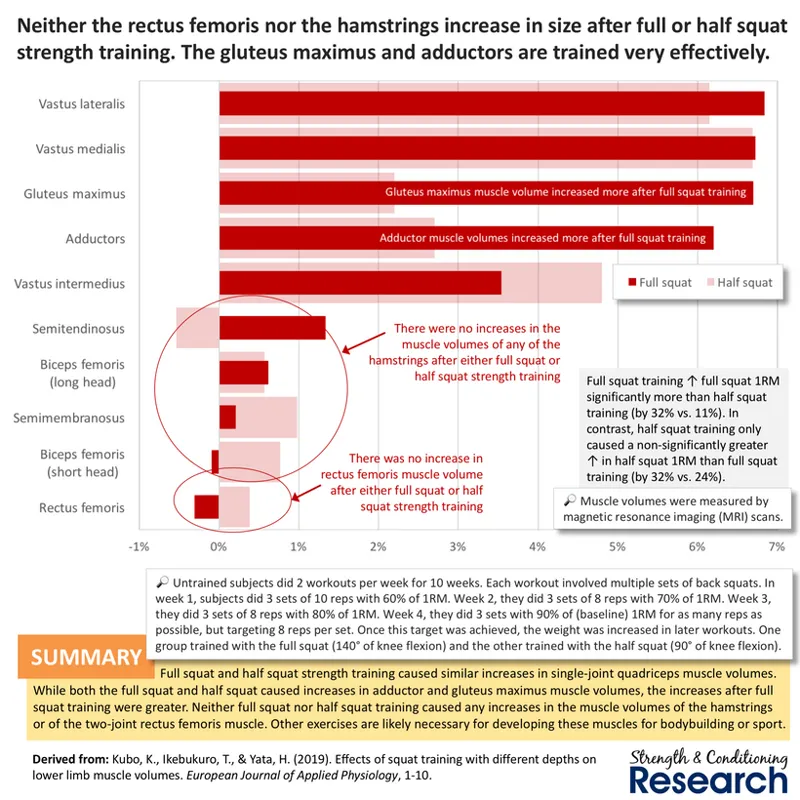
Again, the differences in muscle activation (as measured by T2 signal intensity) between the individual hip extensors and knee extensors correspond to the differences in hypertrophy after long-term training with the same exercise. The single-joint quadriceps and adductors grew substantially, while the hamstrings grew only fractionally, and the rectus femoris did not grow whatsoever.
.
#3. T2 signal intensity using MRI correlates with EMG
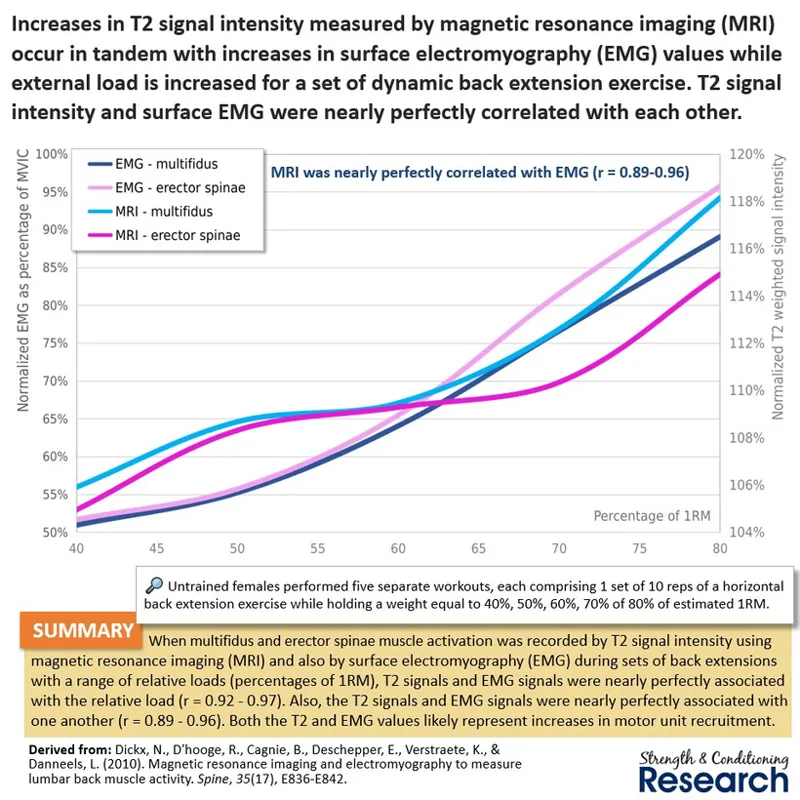
During conventional strength training exercise with weights, measures of muscle activation recorded with MRI and with surface EMG are essentially perfectly correlated with each other. Both measures increase linearly with increasing load when performing the same number of sets and reps, which indicates that increasing effort (and therefore motor unit recruitment) is also associated with these measures of muscle activation. For this reason, we can be reasonably confident that both MRI and EMG measures are relatively good indicators of the extent to which the motor units of a muscle are being recruited relative to other muscles in the same exercise.
.
#4. Mechanomyography (MMG)
Mechanomyography (MMG) uses accelerometers to measure muscle fiber vibrations. Research has shown that measures of muscle force are relatively closely related to MMG measures. Since unfatigued muscle force is itself determined by the number of activated muscle fibers, this indicates that we can use MMG as a proxy for motor unit recruitment in the same way as we can use EMG and MRI scans.
.
#5. Mechanomyography (MMG) correlates with EMG
When testing the relationship between MMG and EMG during inspiratory breathing at different levels of external resistance, measures of muscle activation recorded with MMG and EMG are very strongly correlated with each other. Both measures increase linearly with increasing levels of external resistance, which indicates that increasing effort (and therefore motor unit recruitment) is also associated with these measures of muscle activation.
.
#6. Muscle swelling
Muscle swelling (which is also called the pump) occurs during strength training exercise because of acidosis. When muscle fibers perform glycolysis, they produce hydrogen ions and this alters the osmotic gradient causing water to cross the muscle cell membranes of the working muscle fibers from the blood that is trapped inside the muscle owing to venous occlusion. Thus, the more metabolite-related fatigue, the more cellular swelling (read more).
.
Muscles that display more swelling (compared to others) in an exercise are likely those that are more highly activated. Recent research has shown that the standing calf raise causes the lateral gastrocnemius to swell the most, followed by the medial gastrocnemius, followed by the soleus. The seated calf raise causes the soleus to swell the most, followed by the lateral gastrocnemius, followed by the medial gastrocnemius.
.
Importantly, when long-term measures of muscle growth are recorded, we can see that the standing calf raise causes the lateral gastrocnemius to grow the most, followed by the medial gastrocnemius, followed by the soleus, while the seated calf raise causes the soleus to grow the most, followed by the lateral gastrocnemius, followed by the medial gastrocnemius. This indicates that the immediate post-workout swelling of a muscle (relative to other muscles that are used in the same exercise) is a fairly good indicator of its growth potential.
.
Conclusions
Muscle activation refers to the number of muscle fibers that are switched on inside a muscle during an exercise. Various methods provide insights into muscle activation: [1] electromyography (EMG); [2] T2 signal intensity using magnetic resonance imaging (MRI); [3] mechanomyography (MMG); and [4] muscle swelling. EMG, T2 signal intensity, and MMG have all been shown to correlate with either external exercise load, muscle force, and/or intramuscular pressure during either dynamic or isometric contractions, which indicates that they are a relatively good indicator of the number of activated muscle fibers, which is the primary determinant of muscle force production in such situations. In addition, both MMG and T2 signal intensity have been found to correlate with EMG in muscular contractions, indicating that they are measuring the same underlying factor (exactly as expected based on their relationships with external load, muscle force and intramuscular pressure). In principle, muscle swelling should also be associated with T2 signal intensity since that similarly measures fluid shifts in the exercising muscle, although that has not been investigated. When the various regions of a muscle group are measured during an exercise with either T2 signal intensity or muscle swelling, the areas that display the greatest responses are the same areas that tend to display the most hypertrophy after long-term strength training with the same exercise.

Comments (2)
Love it Chris
Amazing work as always. Thank you for this information Chris!