
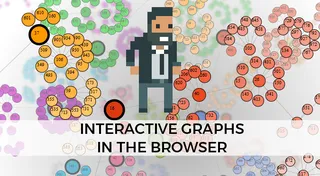
[TUTORIAL] Interactive Graphs in the Browser
http://www.alanzucconi.com/2015/11/01/interactive-graphs-in-the-browser/
This tutorial shows how to use Python and JavaScript to create an interactive graph that you can place in your website. There are two posts in this series.
This post shows how Python can be used to calculate numberical sequences of arbitrary length. It is used to generate thehappification and the melancoil tree, which has been discussed in an episode of Numberphile. You can find a high resolution version (2000x2000px, first 1000 numbers) here: PNG, SVG.
Interactive Graphs in the Browser
The second post shows how to animate a graph in the browser. It uses Python to generate the graph data, and then inputs it to D3, a JavaScript libraries to render SVG drawings. You can find an interactive version here: HTML.